

TL;DR
Token Metrics technicals on BTC have flipped bearish as US strikes on Iran wipe $80B from crypto markets. Bitcoin fell to its lowest level since April 13. The broader market suffered steep losses. Token Metrics technicals read bearish as investors fled risk assets amid heightened geopolitical tensions.
Context
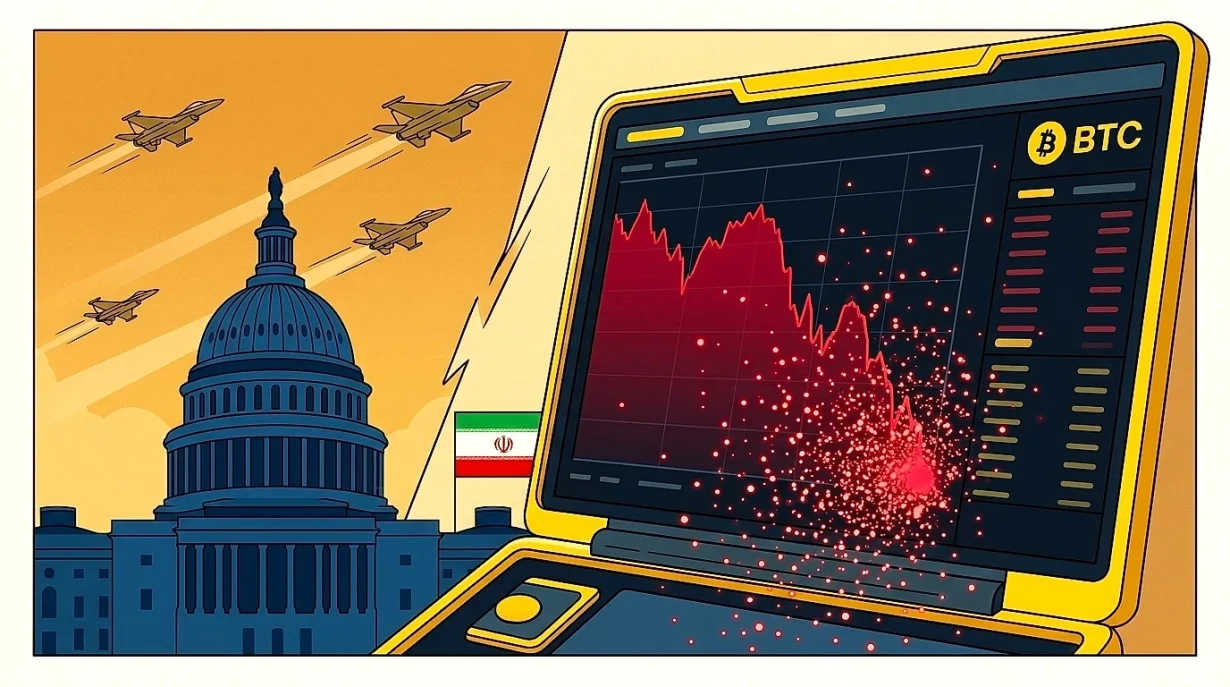
The US military carried out new strikes late Wednesday. They targeted an Iranian military site. Officials shot down four Iranian attack drones near the Strait of Hormuz. A US official told Reuters the actions were measured and purely defensive. Iran’s Islamic Revolutionary Guard Corps responded by attacking a US airbase in Kuwait.
The strikes occurred during peace negotiations. The war began February 28. US President Donald Trump stated at a Wednesday cabinet meeting that he was not satisfied with the current deal. Trump alluded to further military action if negotiations stalled. This marked the second wave of US strikes in three days.
Crypto markets had climbed earlier in the week. Trump had hinted at an imminent peace deal. The strikes reversed that optimism. Markets fell to their lowest level since mid-April. The sell-off accelerated as traders priced in risks. They worried about geopolitical tensions and oil supply disruptions.
Historical patterns show similar reactions. In early 2024, Middle East tensions sparked risk-off moves. Crypto markets typically need 3-5 trading days to stabilize after such shocks. Recovery depends on whether conflicts escalate or de-escalate.
What Token Metrics Data Shows
Data as of May 28, 2026 shows Token Metrics technicals on BTC read bearish. The market reacts to geopolitical shock. The trend has flipped bearish. The token trades sideways inside its recent range. Momentum sits weak but not stretched. Volatility is compressed. This suggests the market isn’t pricing in a big near-term move yet.
Bitcoin trades near $73,144. It is down about 3.4% on the day. It has fallen roughly 5.7% over the past week. The token acts like a high-beta risk asset. It does not behave like a safe haven during uncertainty. This pattern matches historical reactions to geopolitical events.
The token-market signal confirms the bearish bias. Technical indicators point to continued downside risk. Smart-money netflow data shows institutions reducing exposure. This aligns with risk-off sentiment from the Middle East escalation.
Token Metrics Daily Pulse coverage highlights this as a significant market snapshot event. Noting the unusual correlation between traditional geopolitical risks and crypto market reactions. The Daily Pulse team emphasizes that Bitcoin’s response to military action differs from its behavior during purely economic uncertainty.
The technical indicators paint a clear picture. The trend momentum shows bearish pressure building. Momentum sits at 25.59, indicating weak conditions with room for further decline. The trend strength reading of 22.57 suggests the current downtrend has power but isn’t extreme yet. Bitcoin is in a range-bound phase, while trading near the lower band, often a precursor to either a bounce or further breakdown.
Polymarket consensus shows only a 0.1% chance that Bitcoin reaches $92,000 by May 31. This reflects market skepticism about near-term recovery. The probability sits at about $18,900 above current price.
What’s New
The crypto market capitalization dropped by around $80 billion over the past 24 hours. The decline accelerated after news of US military strikes on Iran broke. Bitcoin lost 3.5% on the day. It fell to $72,646 on Coinbase. This marked its lowest level since April 13.
Altcoins followed the downward trend. Solana dropped 3.9%. XRP fell 3.8%. Cardano lost 4.6%. Smaller-cap tokens experienced even larger percentage declines. Liquidity thinned and leveraged positions got flushed out. The market-wide sell-off showed how digital assets connect during systemic risk.
LVRG Research director Nick Ruck spoke to Cointelegraph on Thursday. He said markets sold off as investors priced in risks. They worried about geopolitical tensions and oil supply disruptions. He noted Bitcoin and Ethereum act like high-beta risk assets during uncertainty, despite their hedge narrative.
Crude oil prices also reacted. WTI topped $92 while Brent climbed to $98 per barrel. This 3.5% increase showed traditional markets also feared supply disruptions.
Prior Analogs
This market reaction resembles past instances. Geopolitical tensions triggered crypto sell-offs before. In previous conflicts, Bitcoin initially dropped with risk assets. It sometimes decoupled later as situations evolved. The current pattern mirrors early 2024 when Middle East tensions sparked similar risk-off moves.
Historical data shows crypto markets need time to stabilize. They typically require 3-5 trading days after geopolitical shocks. Recovery speed depends on conflict escalation or de-escalation. Previous military actions in the region led to both temporary dips and longer-term trend changes. The broader market context determined the outcome.
The $80 billion market cap loss represents about 5.4% of total crypto market value. This magnitude matches past geopolitical events. But current market structure differs. Deeper institutional involvement may produce different recovery dynamics compared to earlier cycles.
What to Watch
- Monitor statements from US officials about further military action in the Middle East. Any escalation could trigger more risk-off behavior in crypto markets.
- Watch Bitcoin’s ability to hold key technical levels. Token Metrics identifies these support zones. A break below current levels could speed up selling pressure.
- Track Ethereum’s price action around key support levels. Sustained trading below psychological marks could signal further downside across the market.
- Follow smart-money netflow indicators. Look for signs of institutional re-entry or continued withdrawal from crypto positions.
- Pay attention to funding rates across major exchanges. Spiking negative rates would indicate increased short-selling pressure. This could lead to a short squeeze if conditions stabilize.
- Monitor token-market signal shifts across major cryptocurrencies. These provide early signs of trend reversal or continuation.
This information is for educational purposes only and does not constitute financial advice.