



The Token Metrics app is live at app.tokenmetrics.com, with signals, vaults, and research in one place. Crypto is crowded, so the app starts you with a shortlist of standouts. Token Metrics follows smart money traders and shortlists standout vault strategies, and you can see the track record and the reasons behind each one.
Signals that show how they settled
Prediction-market signals show the side tracked traders took and the price they took it at. Once a market settles, the signal shows Won or Lost. Signal price charts mark the entry point, and each signal explains the reason behind it, not just what it is.
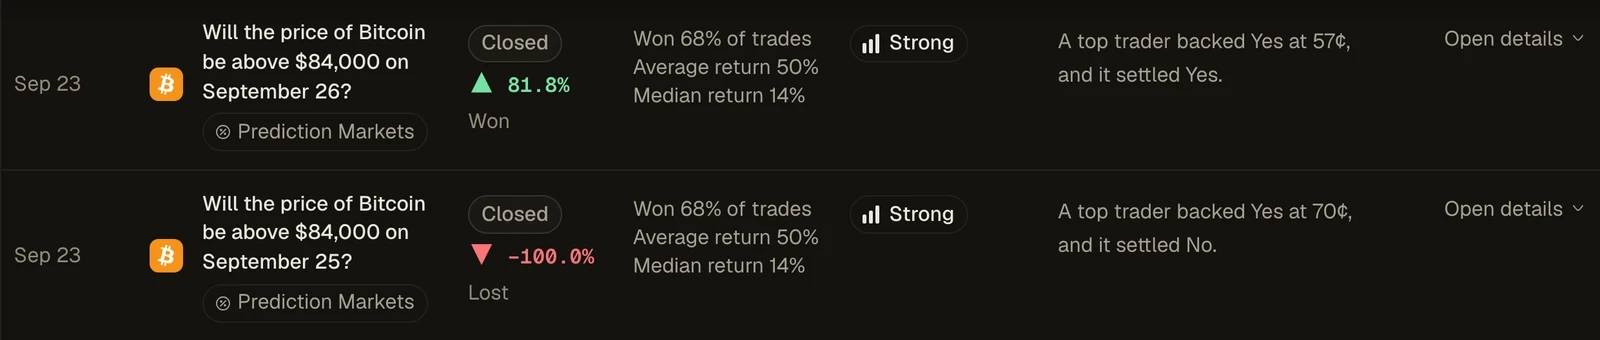
A signal reflects what tracked traders did, not a Token Metrics call. A trader’s past record is evidence of past performance, not proof of future skill. Token signals are paused, so the signals you’ll see right now are prediction-market ones.
Vaults you can compare
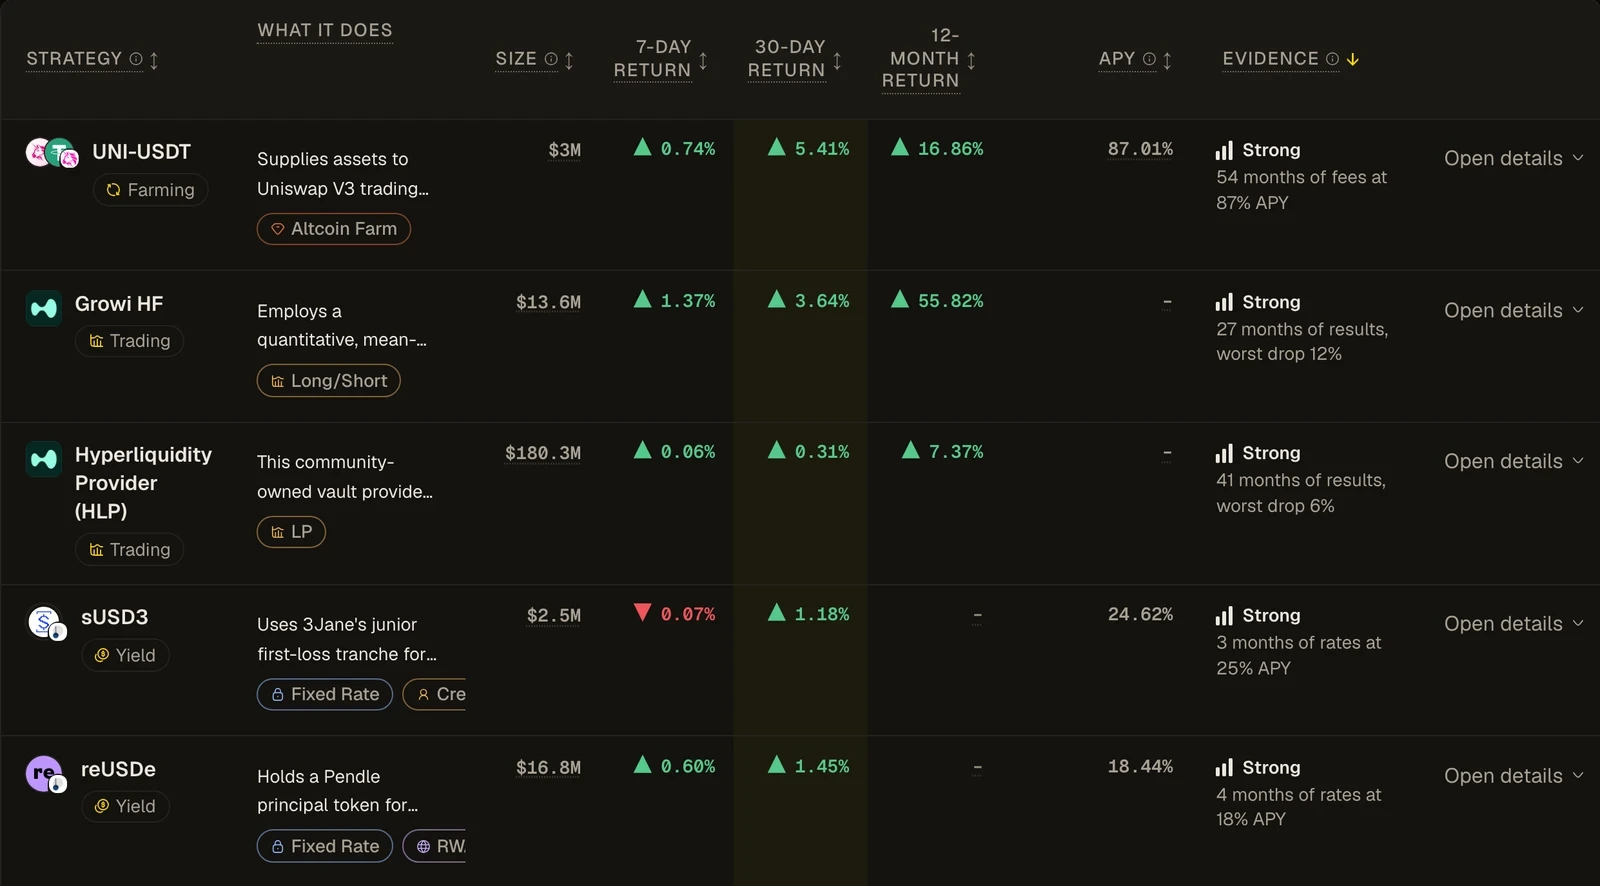
Each strategy card shows how strong the evidence is for that strategy, measured against the standard set for it, so you can see how much backs each vault at a glance. Vault pages now stack into a single column that reads cleanly on a phone, with the key figures, the records, and a short description of the strategy.
The Market tab
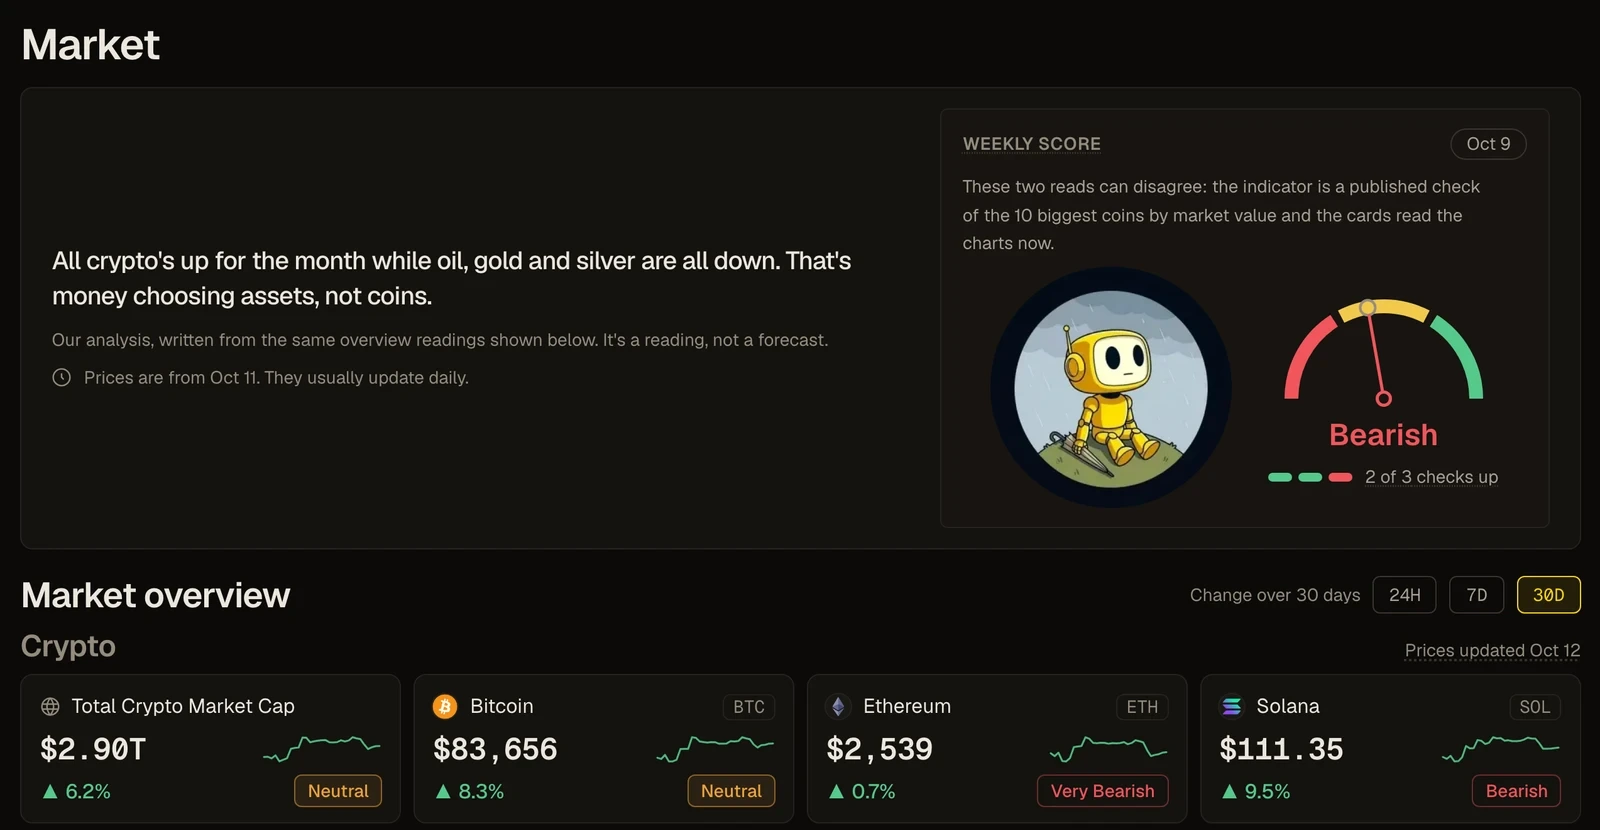
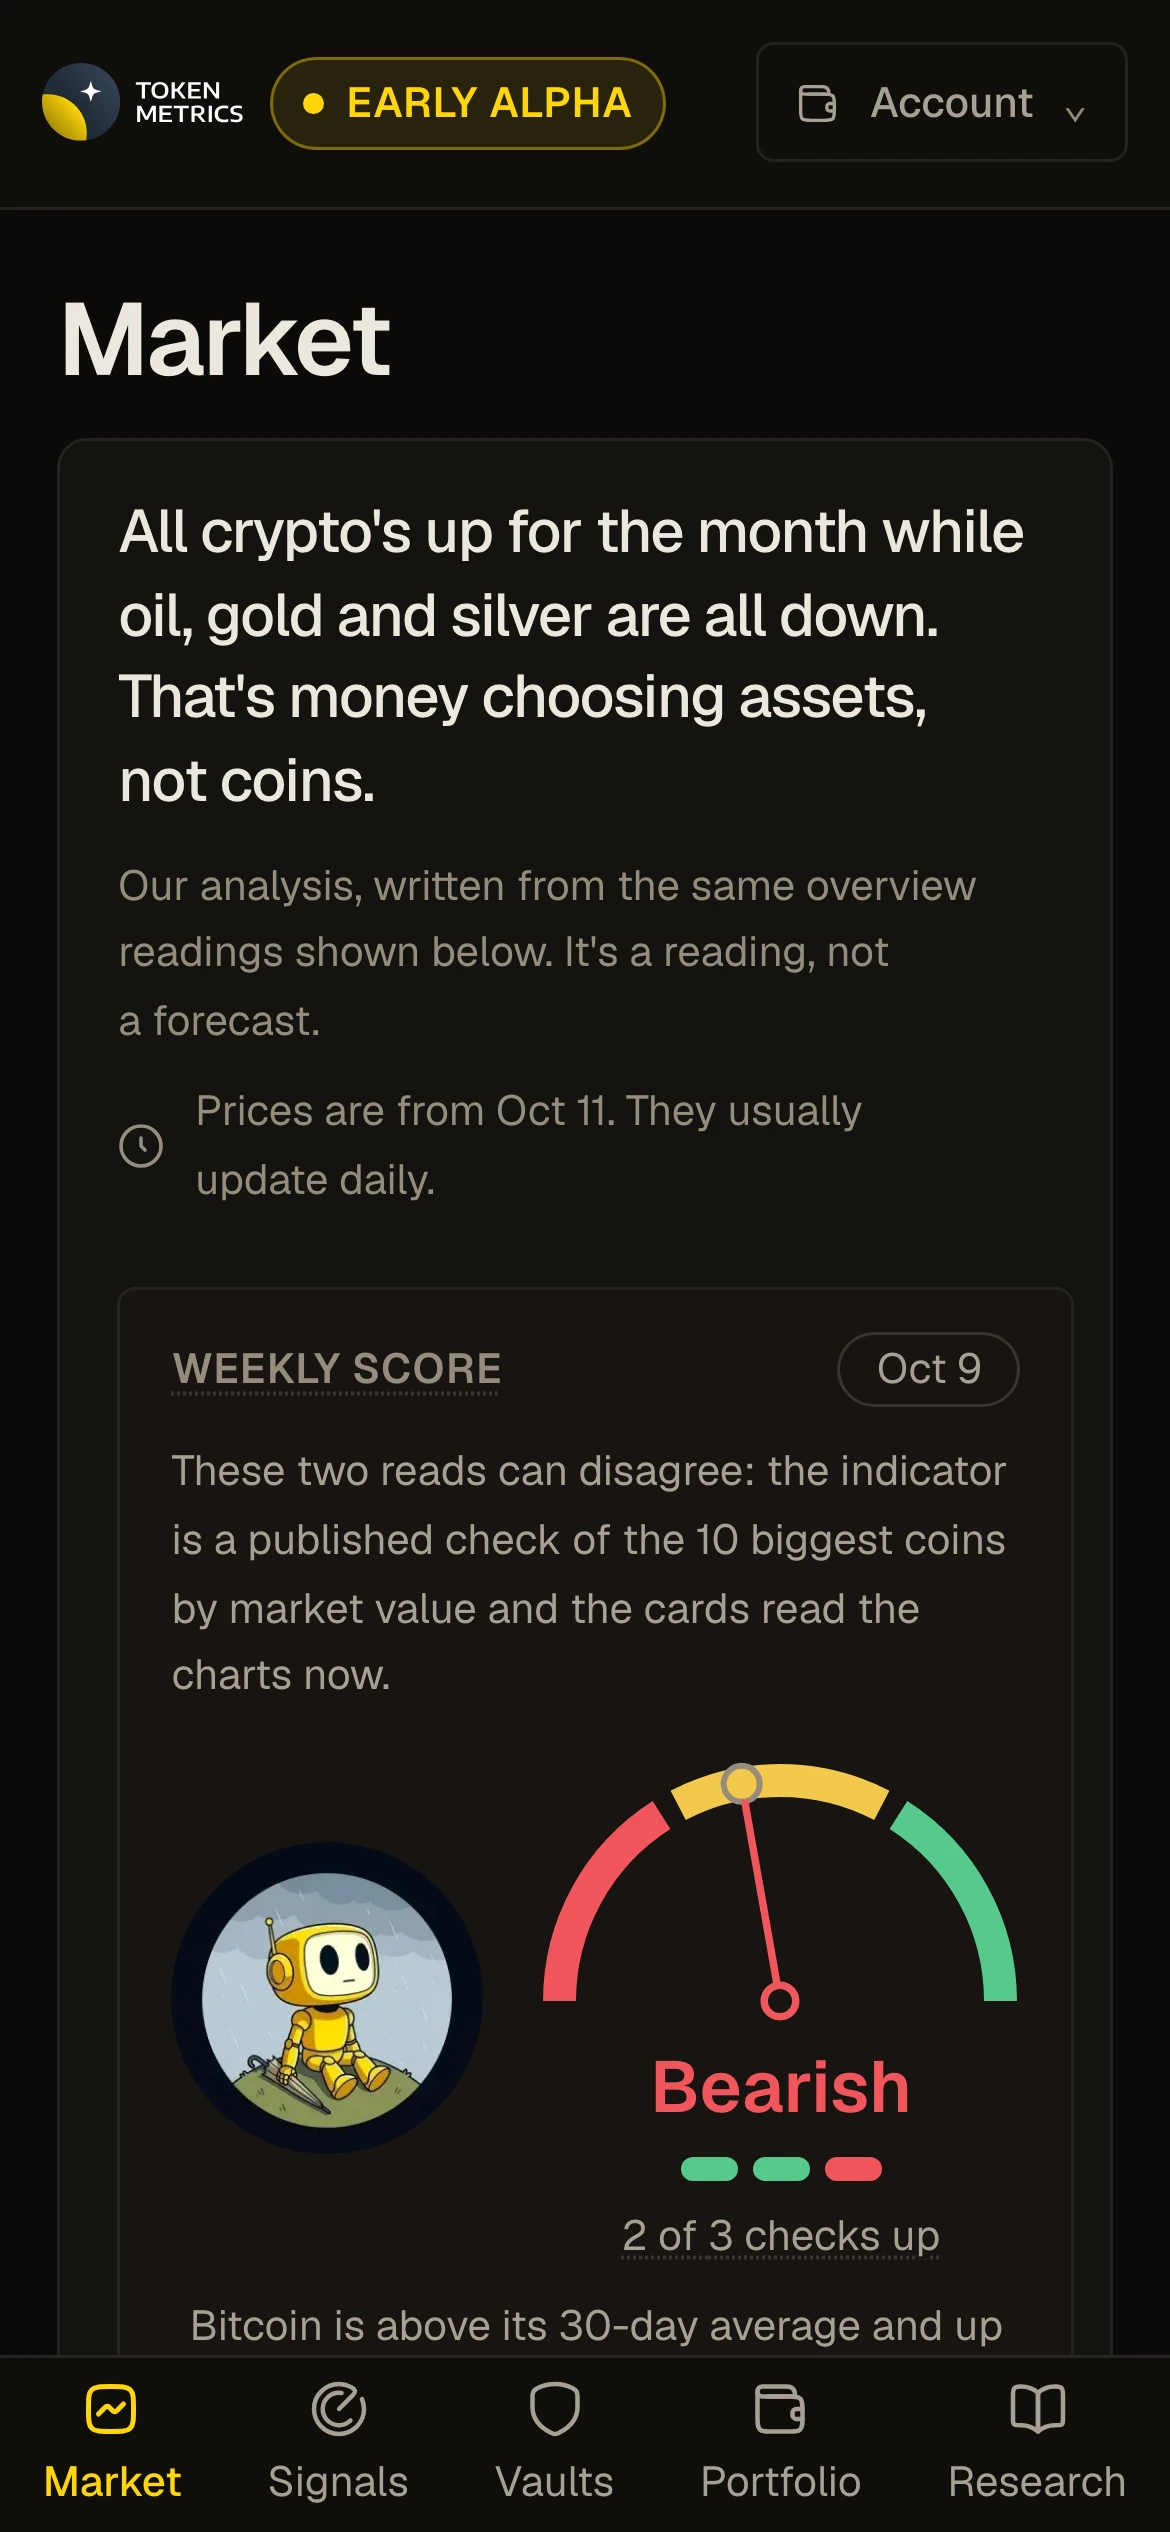
The Market tab opens with a plain read of the market for the day, with a dial that shows the weekly score. Below it is an overview that starts with the total crypto market cap, then the S&P 500, oil, gold, silver, and the Nasdaq 100. Charts follow the overview, so you can see the wider market before you look at any single signal or vault.
Also shipped
- Type filters: pick more than one at a time, with search on the same row.
- Research: filters show true counts, and tapping an empty one explains why it’s empty.
Open the Market tab for the day’s read, then go to Signals to see which side tracked traders took and how each one settled at app.tokenmetrics.com.