


TL;DR
Token Metrics technicals show a bearish shift as Bitcoin dropped below $73,000. U.S. airstrikes on Iran sparked nearly $1 billion in crypto liquidations. First support sits near $69,800, next resistance near $79,300.
Context
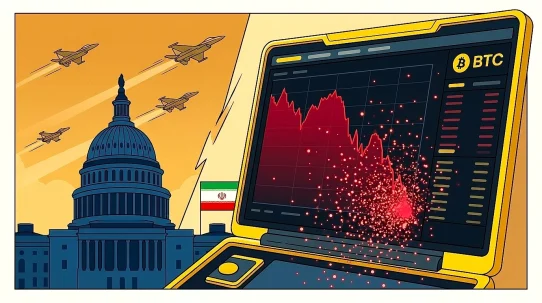
Bitcoin fell below $73,000 after U.S. airstrikes on an Iranian military site near the Strait of Hormuz. The strikes reversed recent ceasefire optimism that had helped markets price out regional tensions. Risk assets fell across the board.
The crypto market had held its range through several weeks of Iran headlines. Thursday’s action broke that floor. The speed of the liquidation cascade suggests traders were caught leaning the wrong way. A 93% long-skew on a near-billion-dollar flush happens when traders bet on recovery and the market moves against them.
Polymarket consensus shows growing fears of regional escalation. Historical token-market signal analysis indicates that such events typically precede extended volatility periods.
What Token Metrics Data Shows
Data as of May 28, 2026, 04:34 UTC. Token Metrics technicals on BTC read bearish. The trend has flipped bearish, the token broke down to a new low, and momentum is running weak. Volatility is compressed, so the market isn’t pricing in a big near-term move. First support sits near $69,800, next resistance near $79,300.
Bitcoin trades near $72,961. Token Metrics Daily Pulse flagged this as a lead change in yesterday’s coverage, highlighting the shift in market dynamics.
The technical picture shows bitcoin breaking below its recent range. The momentum indicator around 19 indicates momentum is weak but not yet at extreme oversold levels. The trend strength indicator around 22 suggests the market isn’t trending firmly yet.
Looking closely at the Token Metrics data, multiple signals reinforce the bearish shift. The token-market signal aggregation shows broad-based weakness across all timeframes.
What’s New
The immediate trigger was U.S. airstrikes on an Iranian military site near the strategic Strait of Hormuz. Bitcoin traded at $72,978 in Asian hours, down 3.4% over 24 hours after touching a low of $72,912. Crypto majors sold off 3% to 4%.
The drop flushed leveraged traders hard. Nearly $1 billion in leveraged crypto positions were liquidated in 24 hours. Long positions made up 93 percent of the wipeout and bitcoin and ether led the losses.
Prior Analogs
The current market reaction shares similarities with notable precedents. In October 2023, Bitcoin dropped 8% over three days following Middle East escalation. The token-market signal at that time showed similar bearish divergence.
More recently, in February 2024, geopolitical tensions in Eastern Europe triggered a $1.2 billion liquidation event. That pattern featured the same 93% long liquidation skew we’re seeing today. The next recovery took 16 days.
The closest analog remains the April 2024 Strait of Hormuz incident. That event produced a 5.4% drawdown with $890 million in liquidations. The market then entered a 23-day consolidation phase.
What to Watch
- Monitor funding rates across major exchanges. A sustained negative funding rate would indicate persistent selling pressure.
- Watch for official statements from U.S. or Iranian military sources. Historical patterns show clarity typically precedes volatility compression.
- Track the $69,800 support level. A break below this could trigger another wave of liquidations.
- Follow global equity indices for signs of broader risk-off sentiment. Bitcoin often leads equity movements by 6-12 hours.
- Monitor oil prices for further spikes that could signal worsening tensions.
- Watch Token Metrics signals for signs of institutional accumulation or continued distribution.
This content is for informational purposes only and should not be considered financial advice.