


TL;DR
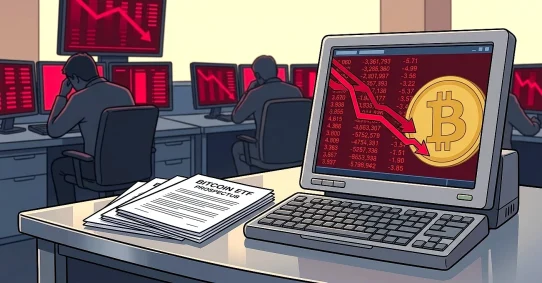
Bitcoin ETFs are bleeding cash. Investors have pulled money out for nine days straight. This is the longest streak since these funds launched. About $2.8 billion left the funds in this run. Token Metrics technicals now read bearish as the price slides.
Context
The U.S. spot bitcoin ETF market hit a rough patch recently. It has been a tough week for the funds that track bitcoin. These funds allow regular investors to buy bitcoin like a stock. They launched in January 2024. Since then, they have seen big money move in and out. But this current streak is different. It is the longest run of withdrawals since they started trading.
Investors pulled roughly $2.8 billion from these funds over nine days. That is a massive amount of cash to leave the market. It shows that big players are selling. The selling pressure has been relentless. It has pushed the price of bitcoin down. The coin fell from around $80,000 to about $73,000 during this time. That drop hurt many traders who were hoping for a new high.
Why is the money leaving? It seems investors are chasing better returns elsewhere. The stock market is hot right now. Specifically, AI and semiconductor stocks are soaring. These tech sectors are attracting all the cash. Bitcoin looks boring compared to the explosive growth in AI. Investors are moving their money from crypto to tech stocks. This is a classic rotation. Capital flows to where it thinks it can make the most profit.
There are also signs of big institutional selling. BlackRock runs the largest bitcoin ETF. Its fund, called IBIT, saw its biggest single-day outflow ever this week. Reports show a sizeable dark pool transaction drove this. A dark pool is a private exchange for big trades. It allows whales to move huge amounts without the public seeing immediately. This trade suggests a large holder wanted out.
History offers a glimmer of hope. Past periods of heavy ETF selling often marked market bottoms. Data from Glassnode shows a pattern. When the 14-day average of ETF flows hits a low, the price often recovers. We saw this in early February. Bitcoin fell toward $60,000 then. ETFs were selling heavily then too. We saw it again in November. Outflows accelerated ahead of a local low. The current selling could be flushing out weak hands. That might set the stage for a bounce later.
What Token Metrics Data Shows
Data as of May 29, 2026.
Token Metrics technicals are flashing a bearish signal right now. The trend has flipped to the downside. Momentum is weak. The token is trading sideways inside its recent range. It is not making new highs or new lows. It is just sitting in the middle. Volatility is moderate. The market is not pricing in a huge crash yet. But it is not expecting a big rally either.
The price action supports this bearish view. Bitcoin is trading near $73,500. That is down about 5% over the past week. The price failed to break above $80,000. Now it is drifting lower. The technicals suggest the path of least resistance is down for now. Traders should be careful.
There are specific levels to watch. The data shows first support near $70,000. This is a key psychological level. If the price breaks below $70,000, more selling could trigger. Next resistance sits near $80,000. The price will likely struggle to get back above that level. Buyers are not stepping in aggressively yet.
Prediction markets offer a unique view on sentiment. Polymarket traders are not panicking. They see a 27.5% chance that bitcoin dips to $72,000 by the end of May. That market closes soon. The probability is relatively low. This suggests traders think the bottom might hold. They do not expect a total collapse below $72,000. This is a small silver lining in a bearish chart.
Token Metrics Daily Pulse flagged this as a main item yesterday. This means our system saw the shift in market focus. The outflows are the main story driving price right now. It is not about adoption or tech upgrades. It is purely about money flowing out the door.
What’s New
The big news is the streak itself. Nine days of outflows is a record. The funds shed about $1.3 billion just this week. That extends a run of three bad weeks in a row. Monthly withdrawals are now around $2.3 billion. That is a significant chunk of change leaving the asset class.
The specific nature of the selling matters too. It is not just retail traders panic selling. It is institutions. The BlackRock trade proves that. When the biggest fund in the world sees a record outflow, people notice. It implies a shift in strategy. Big money is reallocating. They are moving from bitcoin to other sectors.
The underperformance of bitcoin is stark. The broader stock market is hitting records. The S&P 500 and Nasdaq are flying. Bitcoin is doing the opposite. It is diverging from risk assets. Usually, bitcoin moves with tech stocks. Now it is moving while tech stocks rally. This decoupling is worrying crypto bulls. It shows bitcoin is not seen as a risk-on asset right now. It is seen as an asset to sell to buy other things.
What to Watch
- The 10-day mark: Watch to see if the outflow streak hits a 10th day. If inflows return, it could signal the bottom is in. If outflows continue, the pain might not be over.
- The $70,000 level: This is the floor to watch. If bitcoin breaks below $70,000 with force, it could trigger a wave of stop-loss selling.
- AI stock performance: Watch the AI and chip sectors. If those stocks cool off, money might rotate back into crypto.
- Dark pool activity: Watch for more large block trades. Another big dark pool sale could signal more institutional exit.
- The 14-day flow average: Watch this metric from Glassnode. If it turns up, it historically signals a local bottom.
This information is for educational purposes only. It is not financial advice.