


Signal Snapshot
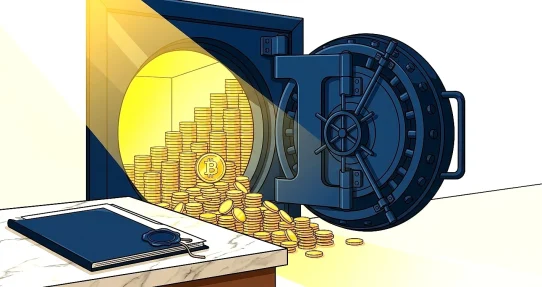
- Bitcoin ETFs just turned positive for 2026 after a $2.4 billion week.
- That weekly inflow is the largest since October. It flipped the yearly flow total back to positive.
- Bitcoin traded around $84,000 at the time of the Token Metrics snapshot. It was flat on the day and up about 3% over the past week.
- Token Metrics technicals read neutral with a firm trend pulse. Price is trading sideways inside its recent range and sits in the middle of that range.
- Polymarket traders doubt a fast push higher in September. One market prices $87,500 near 22%. Two higher targets price near 5% and near 3%.
- Top risk is flow reversal. One big week does not lock in steady demand.
Key Takeaways
- Bitcoin ETFs took in about $2.4 billion in one week. That moved 2026 flows back into positive ground.
- It matters because ETF flows shape near term demand for Bitcoin. Big weeks can calm sellers and pull new buyers back in.
- The real investor read is wait for follow through. Watch next week flows, price holds, and rate news before trusting a new trend.
What Happened
- U.S. spot Bitcoin ETFs just had a huge week. The weekly inflow for Bitcoin ETFs hit about $2.4 billion.
- That is the best weekly total since October. It was enough to turn 2026 net flows positive again.
- Think of it like a bank account that was red all year. One big paycheck just pushed the balance back to black.
- The timing matters. The inflow came as Bitcoin held near $84,000. The coin was flat on the day but up about 3% on the week.
- Total market value sat near $1.7 trillion. That size means ETF flows alone do not set price. But they still move mood.
- The story is a market-structure shift. New demand came through a regulated path. That path lets stock market buyers get Bitcoin exposure without a crypto account.
- ETFs let you buy Bitcoin through a normal brokerage account. That ease is why weekly flow totals get so much focus.
- The largest inflow since October also resets the story for 2026. Earlier selling had kept yearly flows under water. Now buyers have retaken the lead.
- One week does not prove a full turn. It does prove buyers showed up with size. The next test is whether they show up again.
Why It Matters
- ETF flows are real demand. When shares are created, funds buy Bitcoin to back them. When shares are redeemed, they sell.
- A $2.4 billion week means heavy buying pressure landed fast. That can soak up coins for sale and steady price drops.
- It also sends a signal. Other buyers see the flow total and feel safer to step in. Sellers think twice before pressing shorts.
- For builders, steady ETF demand helps planning. It supports jobs, apps, and fee income tied to Bitcoin use.
- For big buyers, it shows access still works. The stock market path can still pull cash into crypto even after a soft year.
- For regulators, it shows the rules path is active. A clear and open ETF market lets demand show in public data each day.
- Here is the second order read. Flows tell us cash arrived. They do not tell us who bought or why they bought.
- Was it fresh long term demand. Was it a short cover. Was it traders playing a rate bet. A holder split would help answer that.
- What would change the read. A fast reversal next week would make this look like noise. Flat flows after one spike often fade from memory.
- What would make it matter less. If price fails to hold near $84,000, buyers may pause. If macro news turns sour, cash may sit out.
- Think of this week like rain after a dry spell. The ground is wet. But one storm does not end a drought. You need more rain.
Token Metrics View
Bitcoin
BTC
—
- The fresh Token Metrics angle starts with policy. A recent catalyst notes the U.S. Senate failed to move the CLARITY Act forward on Sep 15.
- That delay keeps the current rules setup in place for Bitcoin. No new market bill is coming right now. Traders must play the game on the same field.
- That context makes ETF flows more key. With no new law, the approved ETF path stays the main bridge for stock market cash.
- Price action backs the wait and see mood. Bitcoin sat around $84,000. It was flat on the day. It was up about 3% over the past week.
- Market value held near $1.7 trillion. That heft keeps daily moves small in percent terms. But dollar moves still feel large.
- Token Metrics technicals read neutral overall with a firm trend pulse. Momentum sits in the middle. Volatility is calm but not dead.
- In plain terms, price broke out neither up nor down. It is trading sideways inside its recent range. It sits in the middle of that range, not stretched high or low.
- Next resistance sits near $89,000. First support sits near $77,000. Those lines frame the near term box to watch.
- If price holds above support, buyers keep control of the story. If it slips, last week flows lose their glow fast.
- Polymarket consensus leans cool on a September sprint. The $87,500 target for September prices near 22%. That is about $3,500 above spot.
- The $90,000 target for September prices near 5%. That is about $6,000 above spot. The $92,500 target prices near 3%.
- You can see those odds here: Bitcoin $87.5k September market, Bitcoin $90k September market, and Bitcoin $92.5k September market.
- That gap is the story. ETF buyers just pushed hard. Prediction traders still doubt a quick run to $90,000.
- Daily Pulse tagged this as a market snapshot. That fits. This is a flow pulse, not a rule change or a tech upgrade.
- Put it together. Flows turned the year positive. Price held firm. Bets stay shy on new highs. The next inflow print will break the tie.
Market Context
- This is a liquidity story first. Cash moved into ETFs at scale. That eased selling and lifted short term mood.
- It is also a sentiment story. A yearly total back in green feels good. It gives bulls a clear talking point.
- No prior analogs were supplied in inputs. So we will not force a past case. Each flow cycle has its own mix of rates, risk mood, and holders.
- Still, the pattern is known. Big inflow weeks often cluster. Buyers follow buyers. Then flows cool once price stalls.
- The key why now is simple. Bitcoin held its ground near $84,000. That calm base let big orders land without chasing price.
- With the Senate bill stalled, no fresh law is pulling focus. Flows and rates drive the tape now. Policy is on pause.
- For new readers, ETFs matter since 2024. They opened a simple door for funds and retail stock accounts. Flow data now acts like a weekly mood check.
- A $2.4 billion week stands out in that check. It is the best since October. That length of gap makes traders pay more heed.
- But size cuts both ways. Big weeks set a high bar for next week. A drop to flat can feel like a letdown even if holders stay put.
- Watch breadth too. Was buying spread across many funds. Or did one fund do most of the work. Spread demand lasts longer than one whale.
- In short, context says cheer with care. Green yearly flows help. They do not fix macro risk or weak spot buying on exchanges.
Risks to Watch
- Flow reversal is risk one. If next week prints red, this week looks like a one off. Watch daily net totals, not chatter.
- Price risk sits near $77,000 on the low side. A break below that support would sour mood fast. It would test buyer resolve.
- Top side risk is a stall near $89,000. Failures at prior highs often spark selling. Trapped buyers may exit on the next bounce.
- Macro risk is still open. Rate hopes can lift risk assets. Hot inflation or hawk talk can drag them back down.
- Policy risk lingers after Sep 15. The Senate did not move the bill forward. More delay keeps gray zones for builders and funds.
- Selling from long term holders is another risk. High prices can tempt profit taking. ETF buys must then absorb that extra supply.
- Data risk is real too. Flow totals lag by hours. Revisions happen. Do not trade a headline number without the full day file.
- Leverage risk can bite. If futures bets pile up after good flow news, a small dip can force a wave of selling.
What to Watch Next
- Next weekly ETF net flow: does the green streak hold for a second week. Or does it fade back to flat or red.
- Daily flow breadth: are many funds buying or just one or two. Broad buying is a better sign than narrow buying.
- Bitcoin hold near $84,000: can price stay above first support near $77,000. And can it press toward next resistance near $89,000.
- September target markets: does the near 22% odds for $87,500 rise or fall into month end. Moves there show shifting faith in a sprint.
- Macro and policy wires: any fresh rate talk or new Senate action on crypto rules. Either can shift risk mood in a day.
- This is context, not advice. Use it to ask better questions and do your own homework.
Sources / Data Used
- Weekly Bitcoin ETF inflow report
- Token Metrics data used: spot price and 24h and 7d move, market cap, plain English technicals with support and resistance, Senate CLARITY Act catalyst from Sep 15, three Polymarket September targets, Daily Pulse market snapshot tag.