

TL;DR
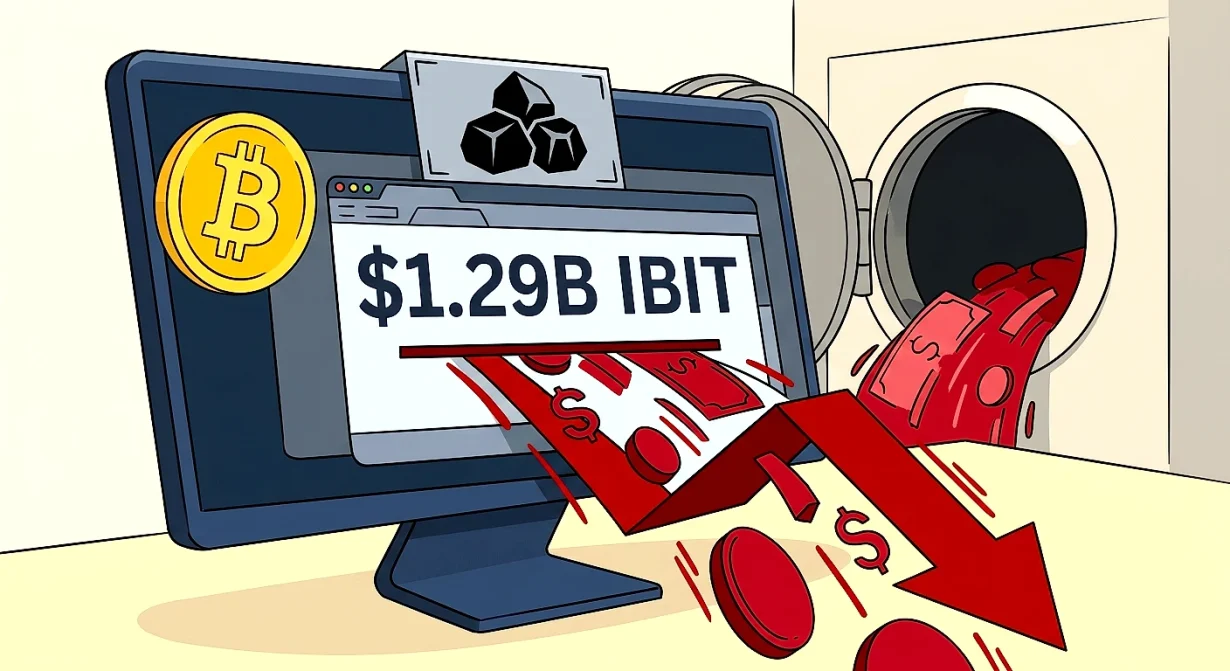
Token Metrics technicals on BTC read bearish as momentum weakens. Coinciding with a $1.29 billion dump of BlackRock’s bitcoin ETF in a dark pool trade. This happened as Bitcoin ETFs posted major outflows. The technical setup remains bearish, with momentum weak and volatility compressed.
Context
Dark pools let big players trade huge blocks without public eyes. An unknown investor used one to dump shares of BlackRock’s IBIT on Tuesday. The trade was worth $1.29 billion. The massive sale wasn’t isolated. U.S. spot bitcoin ETFs saw $333 million in combined outflows on Tuesday. Over the past two weeks, investors have pulled $2.26 billion from these funds.
The regulatory backdrop of these ETFs adds context to the outflows. The SEC approved spot bitcoin ETFs in January 2024 after years of resistance, marking a watershed moment for crypto adoption. These products brought traditional finance infrastructure to Bitcoin exposure. Also introduced new dynamics like daily flow reporting and creation/redemption mechanics that can amplify market movements. Dark pool trading, while legal and common in traditional markets, adds another layer of opacity to crypto price discovery.
What Token Metrics Data Shows
Data as of May 27, 2026 9:02 a.m. UTC.
Token Metrics technicals on BTC read bearish. The trend has flipped negative, suggesting that short-term momentum favors sellers over buyers. This bearish bias indicates that recent price action has established a downward path that could continue if confirmed by further technical signals. The token is trading sideways inside its recent range, showing that while the trend is down. Bitcoin is currently consolidating rather than actively declining. This sideways action often precedes a breakout in either direction, making the current juncture critical for near-term direction.
Momentum sits weak but not stretched, implying that the bearish move still has room to run before becoming oversold. A momentum indicator at 40.9 supports this view, sitting below the neutral 50 threshold but well above oversold levels below 30. This suggests that sellers are in control but haven’t exhausted their conviction, leaving room for additional downside if bearish catalysts emerge.
Volatility is compressed, so the market isn’t pricing in a big near-term move. The average true range percentage of 1.95% shows muted price fluctuations compared to historical averages. Compressed volatility often precedes explosive moves as the market builds energy for a directional break. First support sits near $72,658, representing the level where buyers might step in to halt further declines. Next resistance is near $80,653, marking the ceiling that sellers must break to confirm a more sustained recovery.
Bitcoin is trading near $75,734, off about 1% on the day and down about 2% over the past week. The market cap sits around $1.52 trillion, reflecting the significant size of the Bitcoin market even during periods of decline. A trend indicator shows a bullish crossover despite the overall bearish trend. Creating a mixed signal that suggests some underlying buying interest exists even as short-term momentum favors sellers.
A trend strength indicator at 21.07 indicates weak trend strength. Supporting the view that Bitcoin is in a consolidation phase rather than a strong directional move. A channel indicator shows the price is in range, confirming the sideways trading pattern. Band indicators position the price at the midpoint, further indicating balanced conditions that typically precede breakouts. The trend bias remains bearish, adding weight to the short-term negative outlook despite mixed signals from other indicators.
Polymarket consensus shows high odds of BTC staying above $74,000 by May 28, pricing it near 92%. But they give only a 3% chance of Bitcoin reaching $82,000 between May 25 and May 31. That target sits about $6,300 above the current price. This divergence between near-term protection levels and upside targets reflects a market that defends current levels but lacks conviction for significant gains.
Token Metrics Daily Pulse coverage indicates a lead change in the market. The signal points to shifting momentum in Bitcoin exposure. This classification suggests the recent large ETF movements are more than market noise. They may signal a broader shift in how institutions position themselves for Bitcoin exposure. The smart-money netflow from ETFs shows strong selling pressure. This token-market signal aligns with the bearish technical setup.
What’s New
The headline event was the massive dark pool sale of IBIT shares. A single entity executed this trade on Tuesday. The $1.29 billion size makes it the largest such trade seen by analysts. The sale came during a broader exodus from spot bitcoin ETFs. These funds saw $333 million in combined outflows on Tuesday alone.
This trend of withdrawals has accelerated recently. The past two weeks saw $2.26 billion leave these ETFs. The sustained outflows suggest a shift in investor sentiment toward Bitcoin exposure. The dark pool mechanism itself is notable – these private exchanges allow institutions to move massive positions without immediately impacting public market prices. The fact that such a large trade needed dark pool execution suggests the seller was sophisticated. They avoided market impact while exiting their position.
The timing of this trade is particularly significant given the broader market context. Bitcoin has been trading in a range for several weeks following a strong rally earlier in the year. The appearance of such a large seller during consolidation could show institutions are taking profits. They might be repositioning ahead of market moves. The fact that this occurred in BlackRock’s IBIT specifically is also notable. As BlackRock has been one of the most successful issuers in terms of attracting inflows during the ETF’s first year of operation.
What to Watch
- Watch for continued outflows from spot Bitcoin ETFs. If the streak extends beyond eight days, it would set a new record. This could trigger more price declines as institutional selling persists.
- Monitor Bitcoin’s price around the $72,658 support level. A break below could trigger more selling as traders respond to the breached support.
- Track daily net flows in IBIT specifically. Persistent outflows despite large dark pool trades would show strong bearish sentiment from institutional holders.
- Watch for any news about the identity of the dark pool seller. Large institutional moves can signal broader market shifts if they represent strategic repositioning.
- Keep an eye on volatility levels. Compressed volatility often precedes large price moves. The current low volatility combined with bearish technicals could signal a forthcoming directional move.
- Monitor the broader regulatory environment for announcements or policy changes. These might affect institutional bitcoin exposure, especially banking rules or custodial requirements.
- Track the performance of related assets like gold and other precious metals. Institutional rotation between digital and traditional safe-haven assets could explain the bitcoin ETF outflows.
This information is for educational purposes only and should not be considered financial advice.