

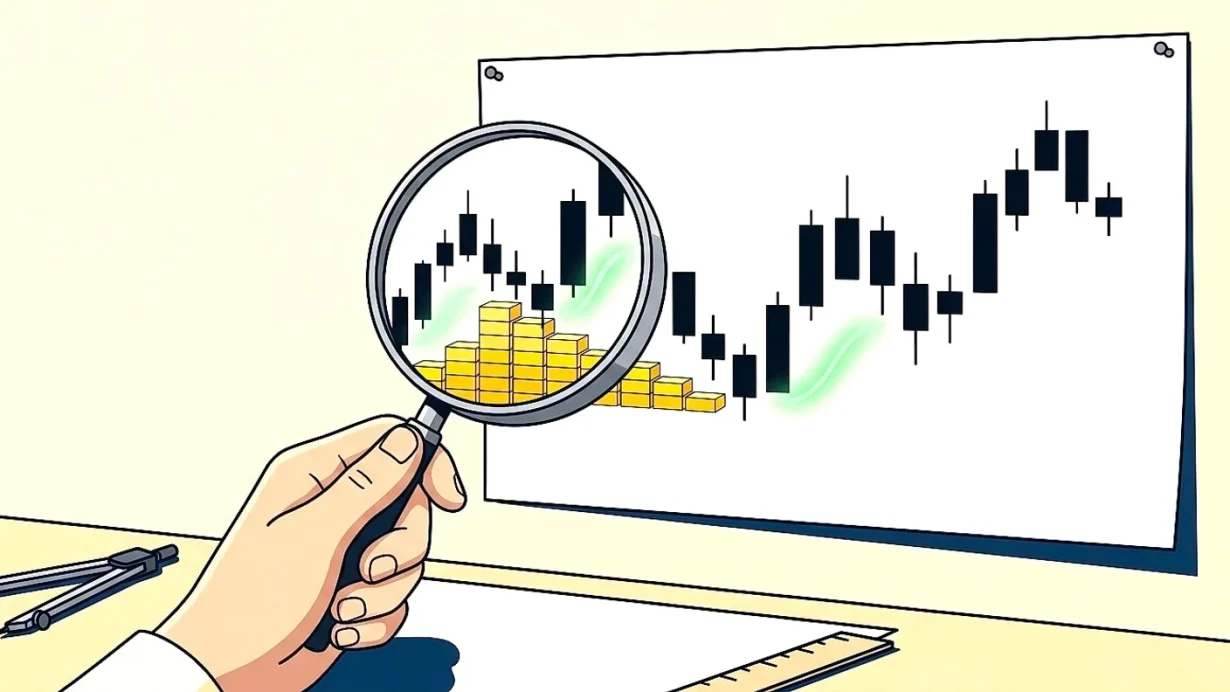

Not every sideways crypto chart means large buyers are stepping in. Price can consolidate for any number of reasons. Volume concentration, momentum and price behavior around important levels can indicate whether sustained buying pressure is developing.
What Institutional Accumulation Can Look Like on a Chart
Institutional accumulation describes large buyers building positions gradually rather than entering the market all at once. In crypto, identifying that behavior is difficult because activity is spread across spot exchanges, perpetual futures and OTC desks, with ETF or treasury flows adding another layer. That’s why price structure is a useful starting point rather than an answer in itself.
A market that repeatedly absorbs selling around the same area without making meaningful new lows may deserve attention. Flat bases can develop as available supply is worked through, whereas rising lows beneath resistance can suggest buyers are entering at progressively higher prices. Wyckoff-style accumulation ranges offer another way of interpreting this behavior, particularly when apparent breakdowns are quickly reclaimed.
This is also where access to a regulated crypto trading platform becomes relevant. OANDA says crypto transactions through its linked offering occur on Paxos’s itBit exchange, which is regulated by the New York Department of Financial Services; OANDA Corporation does not itself transact in or custody those virtual currencies. Detailed charting and reliable execution allow traders to map those levels more precisely and respond when behavior around them changes.
Beyond the shape of the chart, investors should look at the volume.
Volume Profile Shows Where the Market Is Committing
Volume profile shows where trading activity has occurred across different price levels.
High-volume nodes identify areas where substantial trading has taken place. If price repeatedly returns to one and buyers continue to absorb selling, that level may begin to act as support.
Low-volume areas provide a different clue. Price can sometimes move through them quickly, so if it pushes through and subsequently holds above, traders can watch whether that boundary is defended on a retest.
The volume increase is important, but so is where it appeared and how price behaved afterwards.
Momentum Can Shift Before Price Breaks Out
A market does not need to be moving sharply higher for its underlying behavior to improve.
If price continues testing the lower part of a range but relative strength index (RSI) stops making corresponding lows, sellers may be losing influence even though an obvious breakout has yet to appear.
MACD can provide context, too. A histogram change or crossover may indicate that downside momentum is fading, particularly when it occurs around a price level already supported by volume.
In isolation, that signal can easily be temporary. When momentum improves while price holds established support, different parts of the chart begin to support the same interpretation.
Stronger Signals Usually Need More Time
Crypto trades continuously, creating short-term patterns that can disappear almost as quickly as they form. Thin liquidity and leveraged positioning can also make intraday moves appear more significant than they are.
A structure developing over several daily candles therefore carries different weight from one appearing during a brief burst of trading. The higher timeframe can also show whether a supposed accumulation range is part of a broader trend or simply a pause during continued weakness.
Rather than relying on one candle, traders can watch what happens each time the same area is tested. Repeated acceptance above an important level can say more than a single sharp move through resistance.
The Wider Crypto Market Still Matters
Technical signals become easier to interpret alongside what is happening elsewhere in the market.
For major assets, ETF flows or corporate treasury activity may support the idea that sustained demand is developing. On-chain wallet behavior can provide additional context when it points in the same direction as price and volume.
The source of a move is also worth considering. A breakout driven largely by leveraged perpetual futures can look strong while spot demand remains subdued. If spot participation strengthens as the breakout develops, the move has a different foundation from one carried primarily by leverage.
Institutional accumulation is therefore better treated as a working interpretation than a conclusion drawn from one indicator.
Confirmation Matters More Than Predicting the Buyer
The goal is not to identify exactly who is buying. A chart cannot reliably tell you whether a particular fund or other large participant is responsible for activity at a specific price.
Instead, traders can identify levels where behavior is changing and decide what would confirm or invalidate their interpretation.
If resistance breaks, can price remain above it? If the market returns to a high-volume area, does demand reappear or does price fall through the level that was expected to hold?
This shifts the focus from predicting a breakout to observing what the market actually does around predefined levels.
Watch for Accumulation Lookalikes
Not every prolonged consolidation represents large buyers quietly building positions. Sometimes a range is simply indecision.
Weak participation is one warning sign. A breakout can also be misleading if it quickly reverses once the initial activity disappears.
Illiquid altcoins require extra care because shallow order books and exchange-specific flows can distort chart structures. Token unlocks or headline-driven jumps may also create the appearance of demand without sustained spot buying behind them.
The reaction after an apparent signal can therefore be more useful than the signal itself. When price breaks an important level and later returns to it, the retest shows whether that level is still being defended or has quietly been given up.
Final Thoughts
No single indicator confirms institutional accumulation on its own. Volume shows where the market has committed, momentum shows whether selling pressure is fading, and price structure shows whether a level is holding. When those line up, the case gets stronger; when they don't, it's usually just noise.
The goal isn't to call the bottom, but to watch how price behaves the next time it tests a level that matters.
This article is for informational purposes only and is not financial advice.